AO3 Statistics Tracker
Important News
Version 2.0.0 uses Indexed DB instead of local storage to store the data in the browser. For end users, this essentially means a lot more data can be stored. It also secures against interference from other scripts.
However, it also means that any old data must be transferred over this one time. A separate button to transfer the data has been added, but will be removed in any versions going forward after v2.0.0, to avoid clutter.
About
This is a script meant to track a user's statistics for Archive of Our Own (aka AO3). It can track the total statistics and stats for individual works. The tracked data is stored in the browser's indexed DB (database) and displayed using Chart.js.
The script works by reading the numbers on the page. To ensure that the most recent stats are tracked, refresh the page if it has potentially old data.
The functionality is added through buttons on the bottom of the "totals" statistics group on the user's statistics page. The buttons are styled to match the applied site skin, but might not have perfect coverage of all possibilities.
Important Notes:
- The data being stored locally means that switching browsers, clearing data, or reinstalling the browser will cause loss of data. Use the "export" functionality to create backups.
- When changing between views (all years/specific year, fandom view/flat view, etc.) it might take the script some time to reapply.
- The script only reads off the screen. It does not distinguish between stats across all years and those for a specific year, nor between different accounts or similar. Mixing these are a misuse of the script and users will have to manually remove such "invalid" records from the indexed DB.
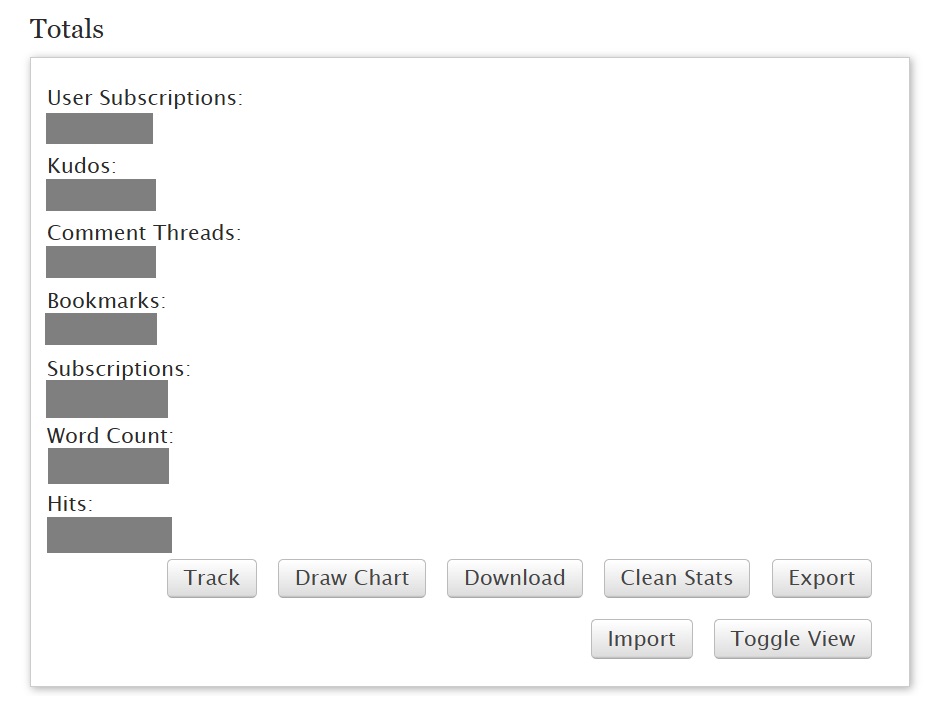
Action buttons with default skin (real statistics redacted).
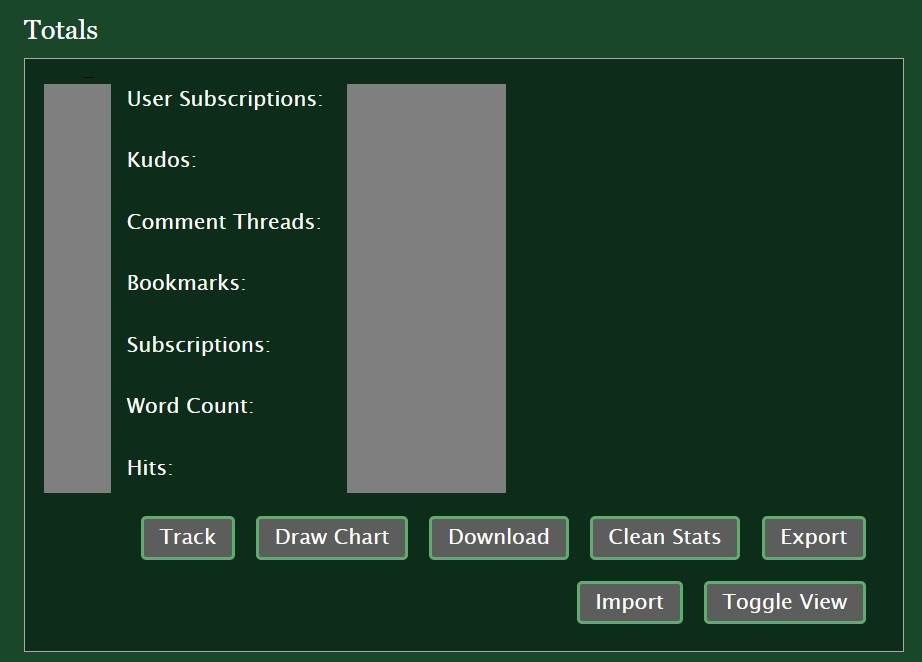
Action buttons with custom site skin (real statistics redacted).
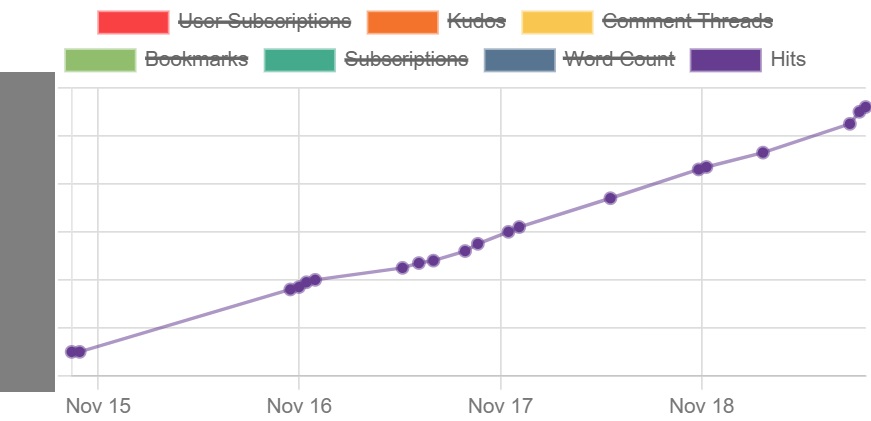
Statistics chart (real statistics on y-axis redacted), displaying hits.
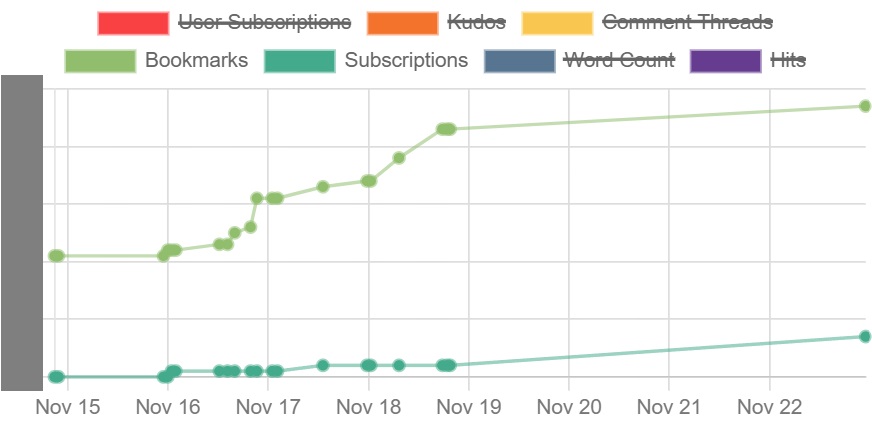
Statistics chart (real statistics on y-axis redacted), displaying bookmarks and subscriptions.
Functionality
Track Stats
Stores the total stats (always) and the work stats (if the INCLUDE_WORKS flag is set to true). Use the export/import functionality to create and store backups securely.
Users with many works might want to consider setting the INCLUDE_WORKS flag to false, to avoid storing too much data. If someone experiences that the statistics are not being updated despite clicking the button to track them, check that the indexed DB is not full. (Max storage limit depends on device and permissions, but ranges from a few dozen MegaBytes to multiple GigaBytes). If the DB is full, then export the stats/download chart, clear out the indexed DB, and start anew.
By editing the STATS flag, users can choose which stats should be tracked. All are turned on by default.
Draw Chart and Toggle View
Draws a chart of the statistics. The chart for "total" statistics is drawn by default. Each work also has a button to draw a chart for that work. Each chart has the option to toggle view (hide/show chart) with a small animation.
Note: Drawing a chart is not the same as tracking stats. It's usually a good idea to track stats first. Tracking stats automatically draws the updated chart. Track and draw are separate options in case the user wishes to re-draw the chart but doesn't find it worth it to store the new (and perhaps unchanged) stats.
By setting the THEME_MODE flag, users can decide what color theme they want on the chart (light or dark mode). The chart shows the "hits" statistics by default, as this is usually the most frequently updated stat. All statistics types are drawn in the same chart and they may have widely different values. It is therefore recommended to only show stats in close ranges at the same time. Chart.js has the in-built function to toggle options on/off.
Change the values returned from the getTheme function to customize the colors beyond theme mode.
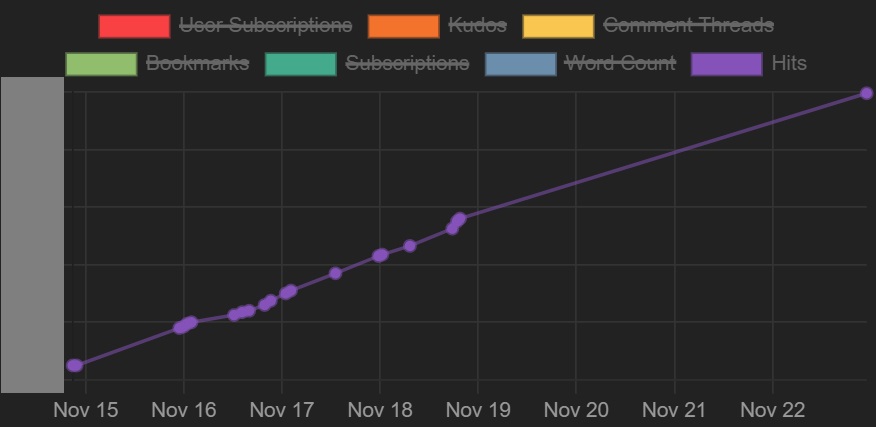
Statistics chart (real statistics on y-axis redacted), displaying hits (dark mode).
Download
Download a PNG image of the chart, as displayed in the browser.
Clean Stats
Users might want to track statistics frequently to make sure the statistics are as accurate as possible for their purposes, but they might not want to keep all the points since that clutters the storage with unnecessarily many data points. Cleaning the stats removes "unnecessary" points. A data point is deemed unnecessary if it is less recent than another data point within a time range.
Use the CLEAN_DATA flag to decide the time range. Options are "hour", "day" and "month".
For example, a user has set CLEAN_DATA to "hour". The user has the data points for a day at 09:01, 09:46, 09:58, 10:13, 10:39, 14:28, and 14:30. Only the data points at 09:58, 10:39 and 14:30 are kept, since they are the most recent within that hour.
Export and Import
The data stored in local storage can be exported into a CSV file. CSV files of valid format can also be imported and stored.
Set a custom DELIMITER flag if the default one clashes with a work name. The delimiter should be a character or string that is not included in any statistics name or work name.
Tips: Exported files can be used as backups, can be used to make custom charts in external software, and can be spliced together to make a larger record of stats. Imported files can be made manually by a user. If the user has estimations or records of stats from elsewhere that they want to include in the chart, they can make their own CSV file. Export a file to look at the correct formatting and replicate it.
Script dependencies
Chart.js v4.4.6
Chart.js adapter date-fns v3.0.0
FAQ
- Q: I'm using Greasemonkey. Why isn't it working? A: Try using the Tampermonkey extension instead.
